
The time of “easy money” in stock photography is long gone. In fact, many contributors have been saying that microstocks “are dying” for a good 10 years already. And yet there are many who manage to earn decent money even today (at least, accordingly to the 2024 survey). However, nobody’s road was smooth sailing and, as the said survey showed, there was a breaking point at around the 4-year mark, after which people were divided into those who stayed and started earning more and those who failed “completely”.
“The only real mistake is the one from which we learn nothing”, Henry Ford once said. This is as true of microstocks as it is of any other human experience. In this blogpost we cycle back to data analysis we did for best-selling stock photo categories to take a look at the other side of the coin: what didn’t sell and try to uncover why.
About this study
Steve Heap from Backyard Silver has kindly provided his extensive data that we have already explored in this blog some time ago. We’re looking at a portfolio with about 15,000 assets that is sold on about 15 agencies such as Shutterstock and Adobe Stock.
Note that data has a cutoff point in early 2023 - this makes about 16 years of data available.
Another important note is that this data analysis includes photos that were sold at least once. So it does not include completely unsold photos, as of the cutoff point in 2023. Even being incomplete, it still shows interesting insights, as you can see below.
IMPORTANT: The sales performance of your files on microstocks depends on a variety of factors, such as customer demand, existing/following competition, luck, and many others. Since we cannot account for all of these factors, we explore only what we can: the category/timing angle.
Low earners analysis
Steve sells his photos at over 14 agencies. This is a great diversification not only in the sense of “what happens if the agency shuts down”, but because some content sells better at different agencies. Looking from another side, one can also say that at different agencies different content does not sell well.
here and below, “low seller” means a file that over the lifetime earned less than $1
Here’s Steve’s portfolio composition across all agencies, split by “good” and “bad” files, from the point of view of earnings.
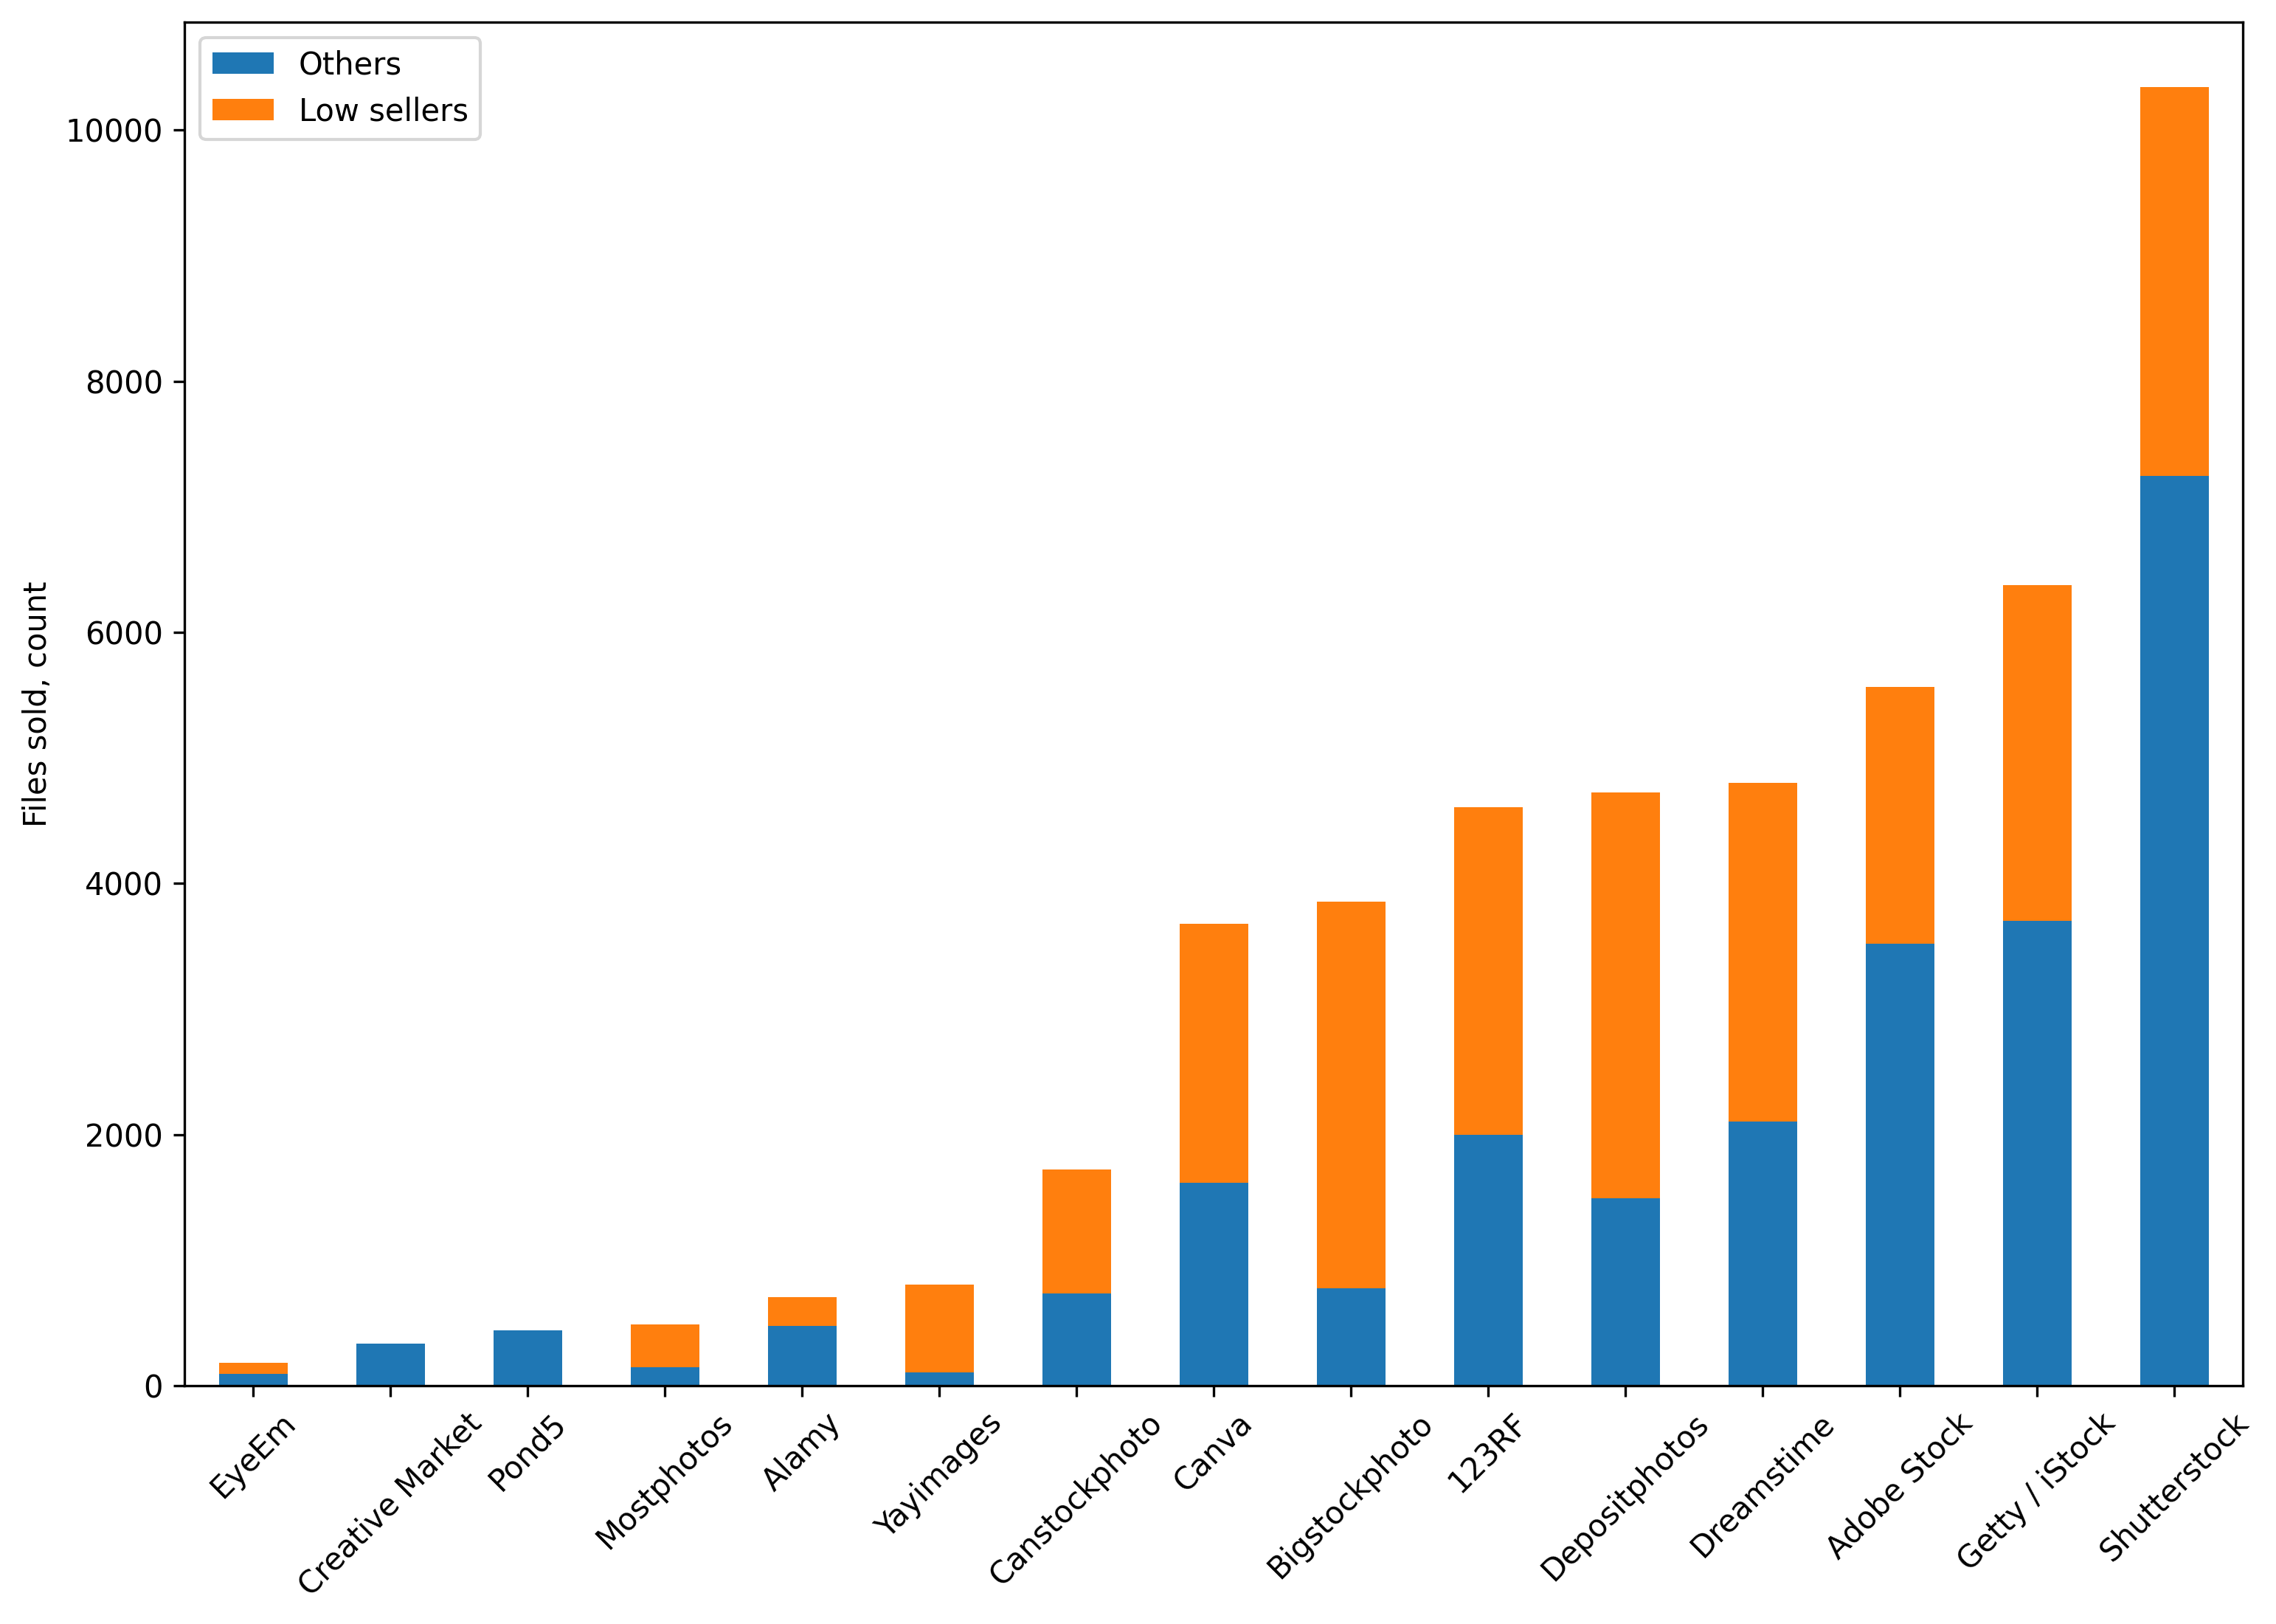
Portfolio split between 'low sellers' and 'business-as-usual' files
Interesting to see that the majority of agencies contain large chunks of “low sellers”, but some agencies are much worse than the others: notably Bigstockphotos, Depositphotos, YayImages and Envato Elements. They contain way more than half of the low earners, potentially also lowering the ranking of another part of the portfolio.
Largest Steve’s portfolios are at Shutterstock and Adobe Stock (Fotolia in past) so we will scrutinize them in more details.
Shutterstock
First of all, let’s split these unsold photos on Shutterstock into buckets based on their category.
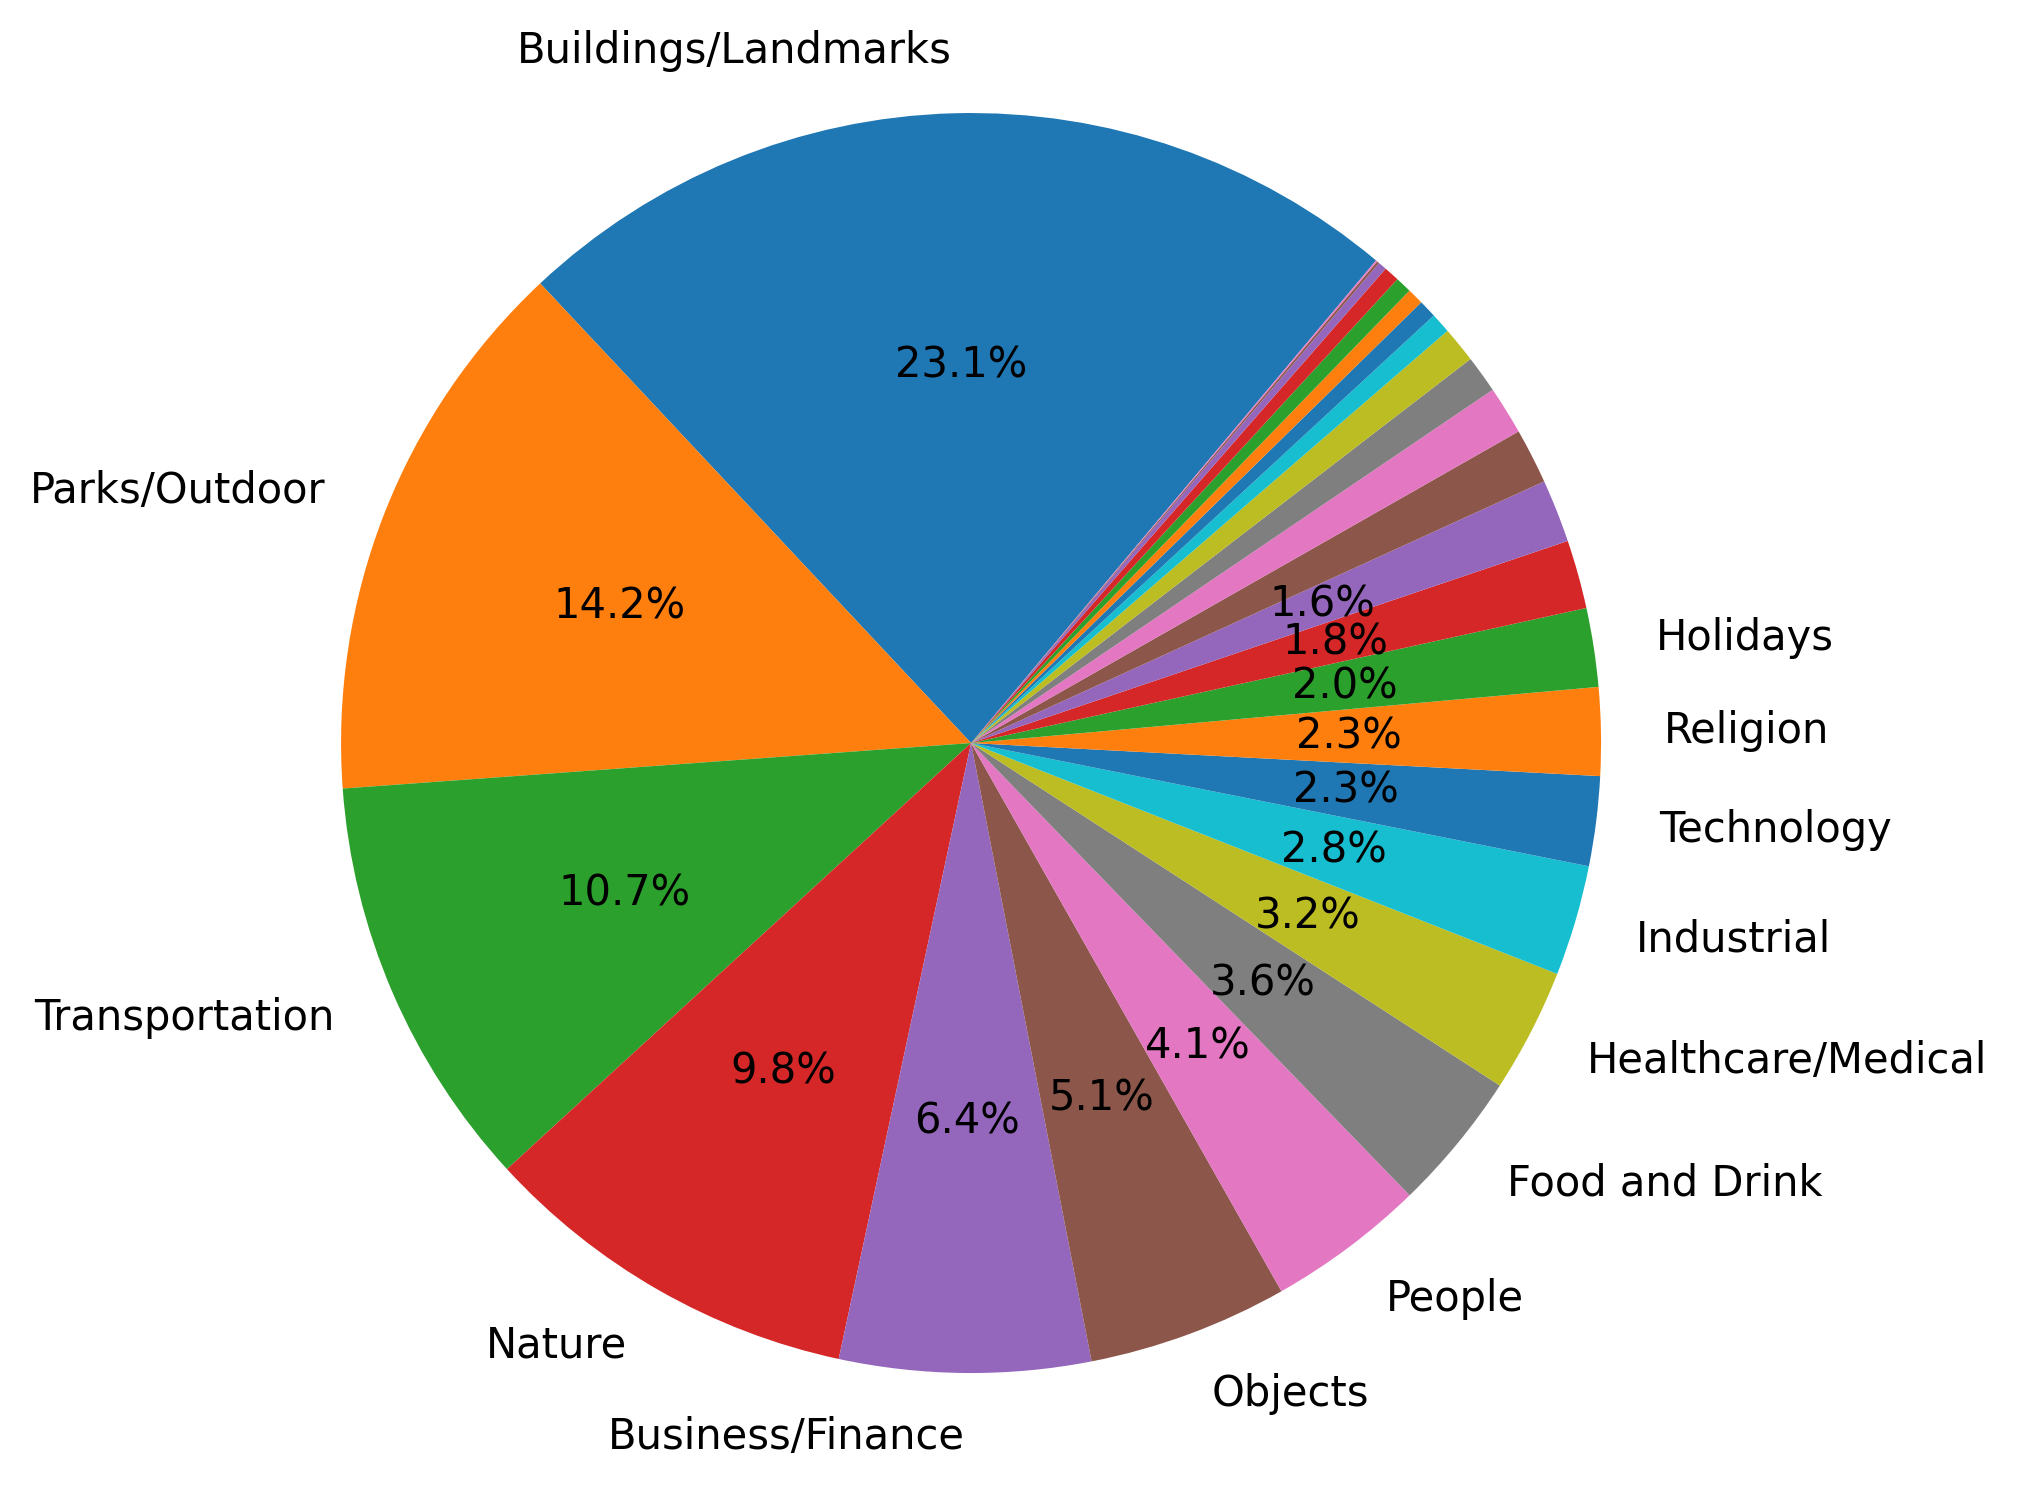
Split by category on Shutterstock
This does not tell much, because there’s a large intersection with Steve’s best-selling categories. In fact, it’s normal that not every photo you create will sell. Instead, let’s compare the selling ratio within each category:
NOTE: these are not the earnings amounts, but the file counts, which yielded good and low earnings
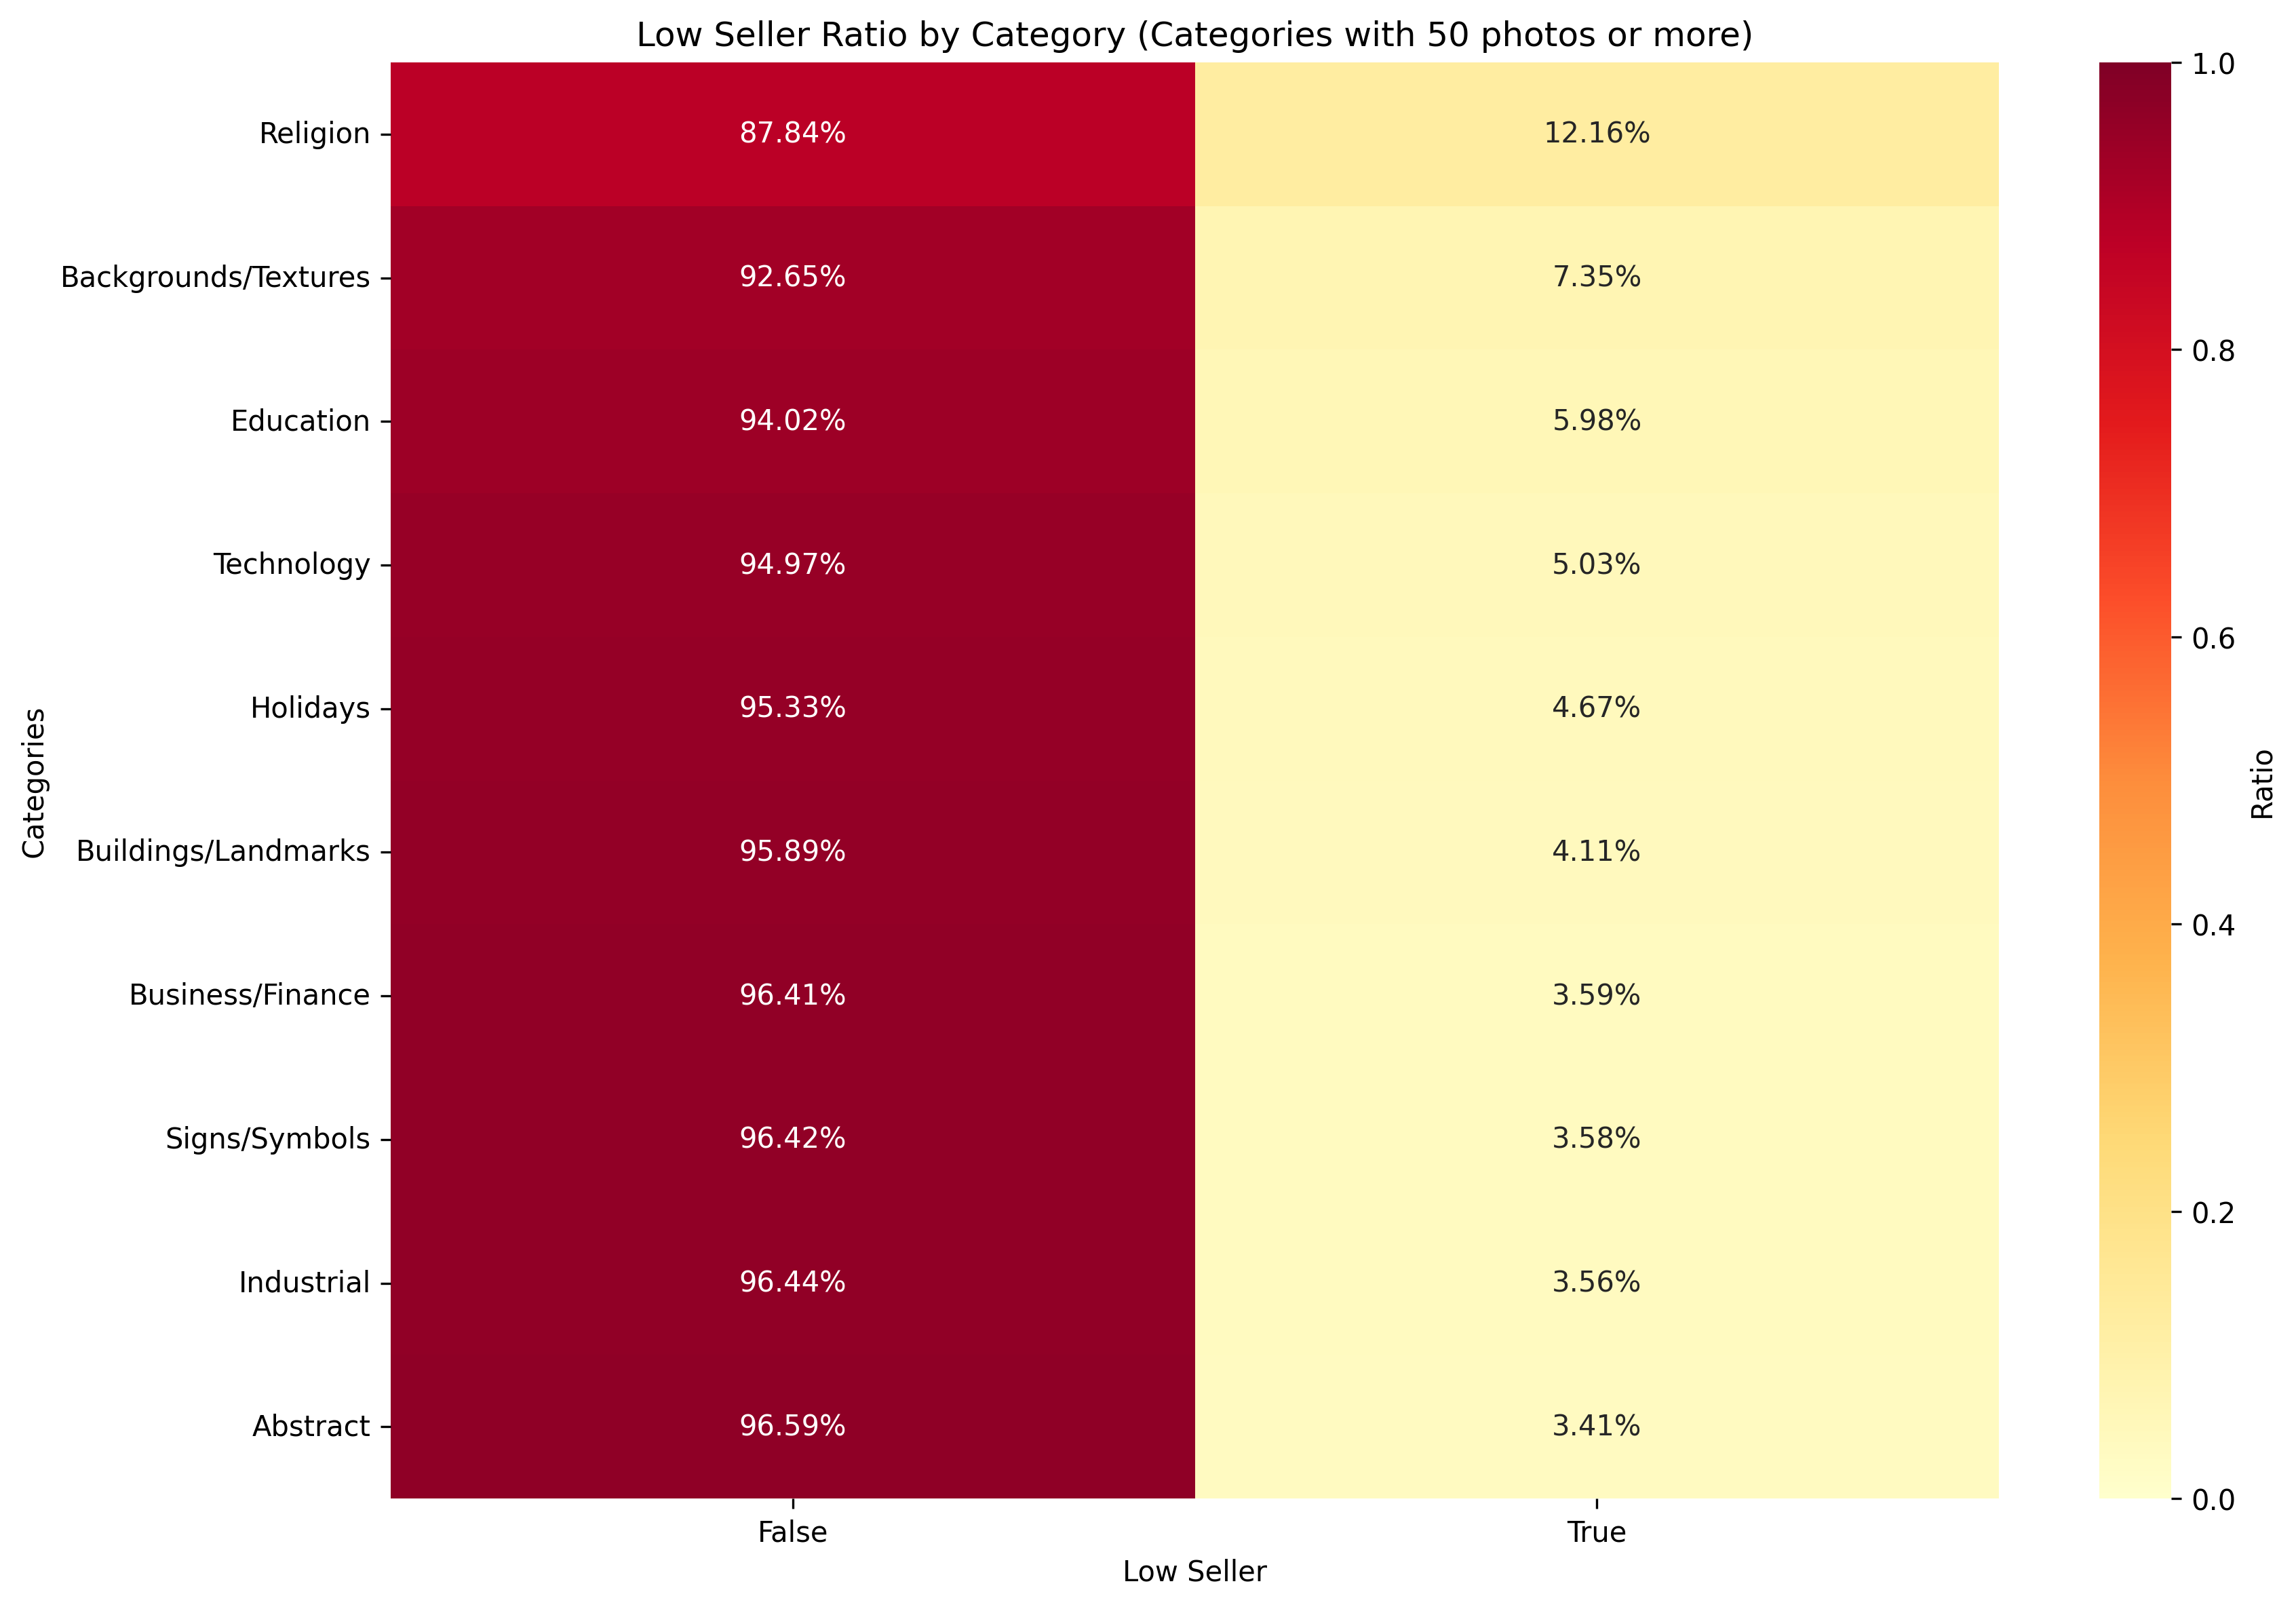
Shutterstock ratio of 'low sellers' and 'business-as-usual' per category
Here are the 5 largest ones, that were not so good:
| Category | “Good” sellers (% of total) | “Bad” sellers (% of total) |
|---|---|---|
| Religion | 87.84% |
12.16% |
| Background/Textures | 92.65% |
7.35% |
| Education | 94.02% |
5.98% |
| Technology | 94.97% |
5.03% |
| Holidays | 95.33% |
4.67% |
Apparently, for Steve on Shutterstock, “Religion” and “Background/Textures” were the riskiest businesses to make content for, closely followed by “Education”, “Technology” and “Holidays”.
To me, this also begs the question of what were the “safest” bets to make content for and here they are:
| Category | “Good” sellers (% of total) | “Bad” sellers (% of total) |
|---|---|---|
| Interiors | 97.51% |
2.49% |
| Objects | 97.85% |
2.15% |
| Transportation | 98% |
2% |
| Animals/Wildlife | 99.2% |
0.8% |
I bet the “Animals/Wildlife” category is mostly Steve’s cats, as we already established before how well they sell (some of Steve’s best-sellers). It is also the “safest” category on Shutterstock for Steve, meaning that almost all files in it were yielding good sales.
Adobe Stock
Now we can take a look at Adobe Stock. Despite the fact that general buckets with categories are not useful on their own, it’s easy to compare with Shutterstock above.
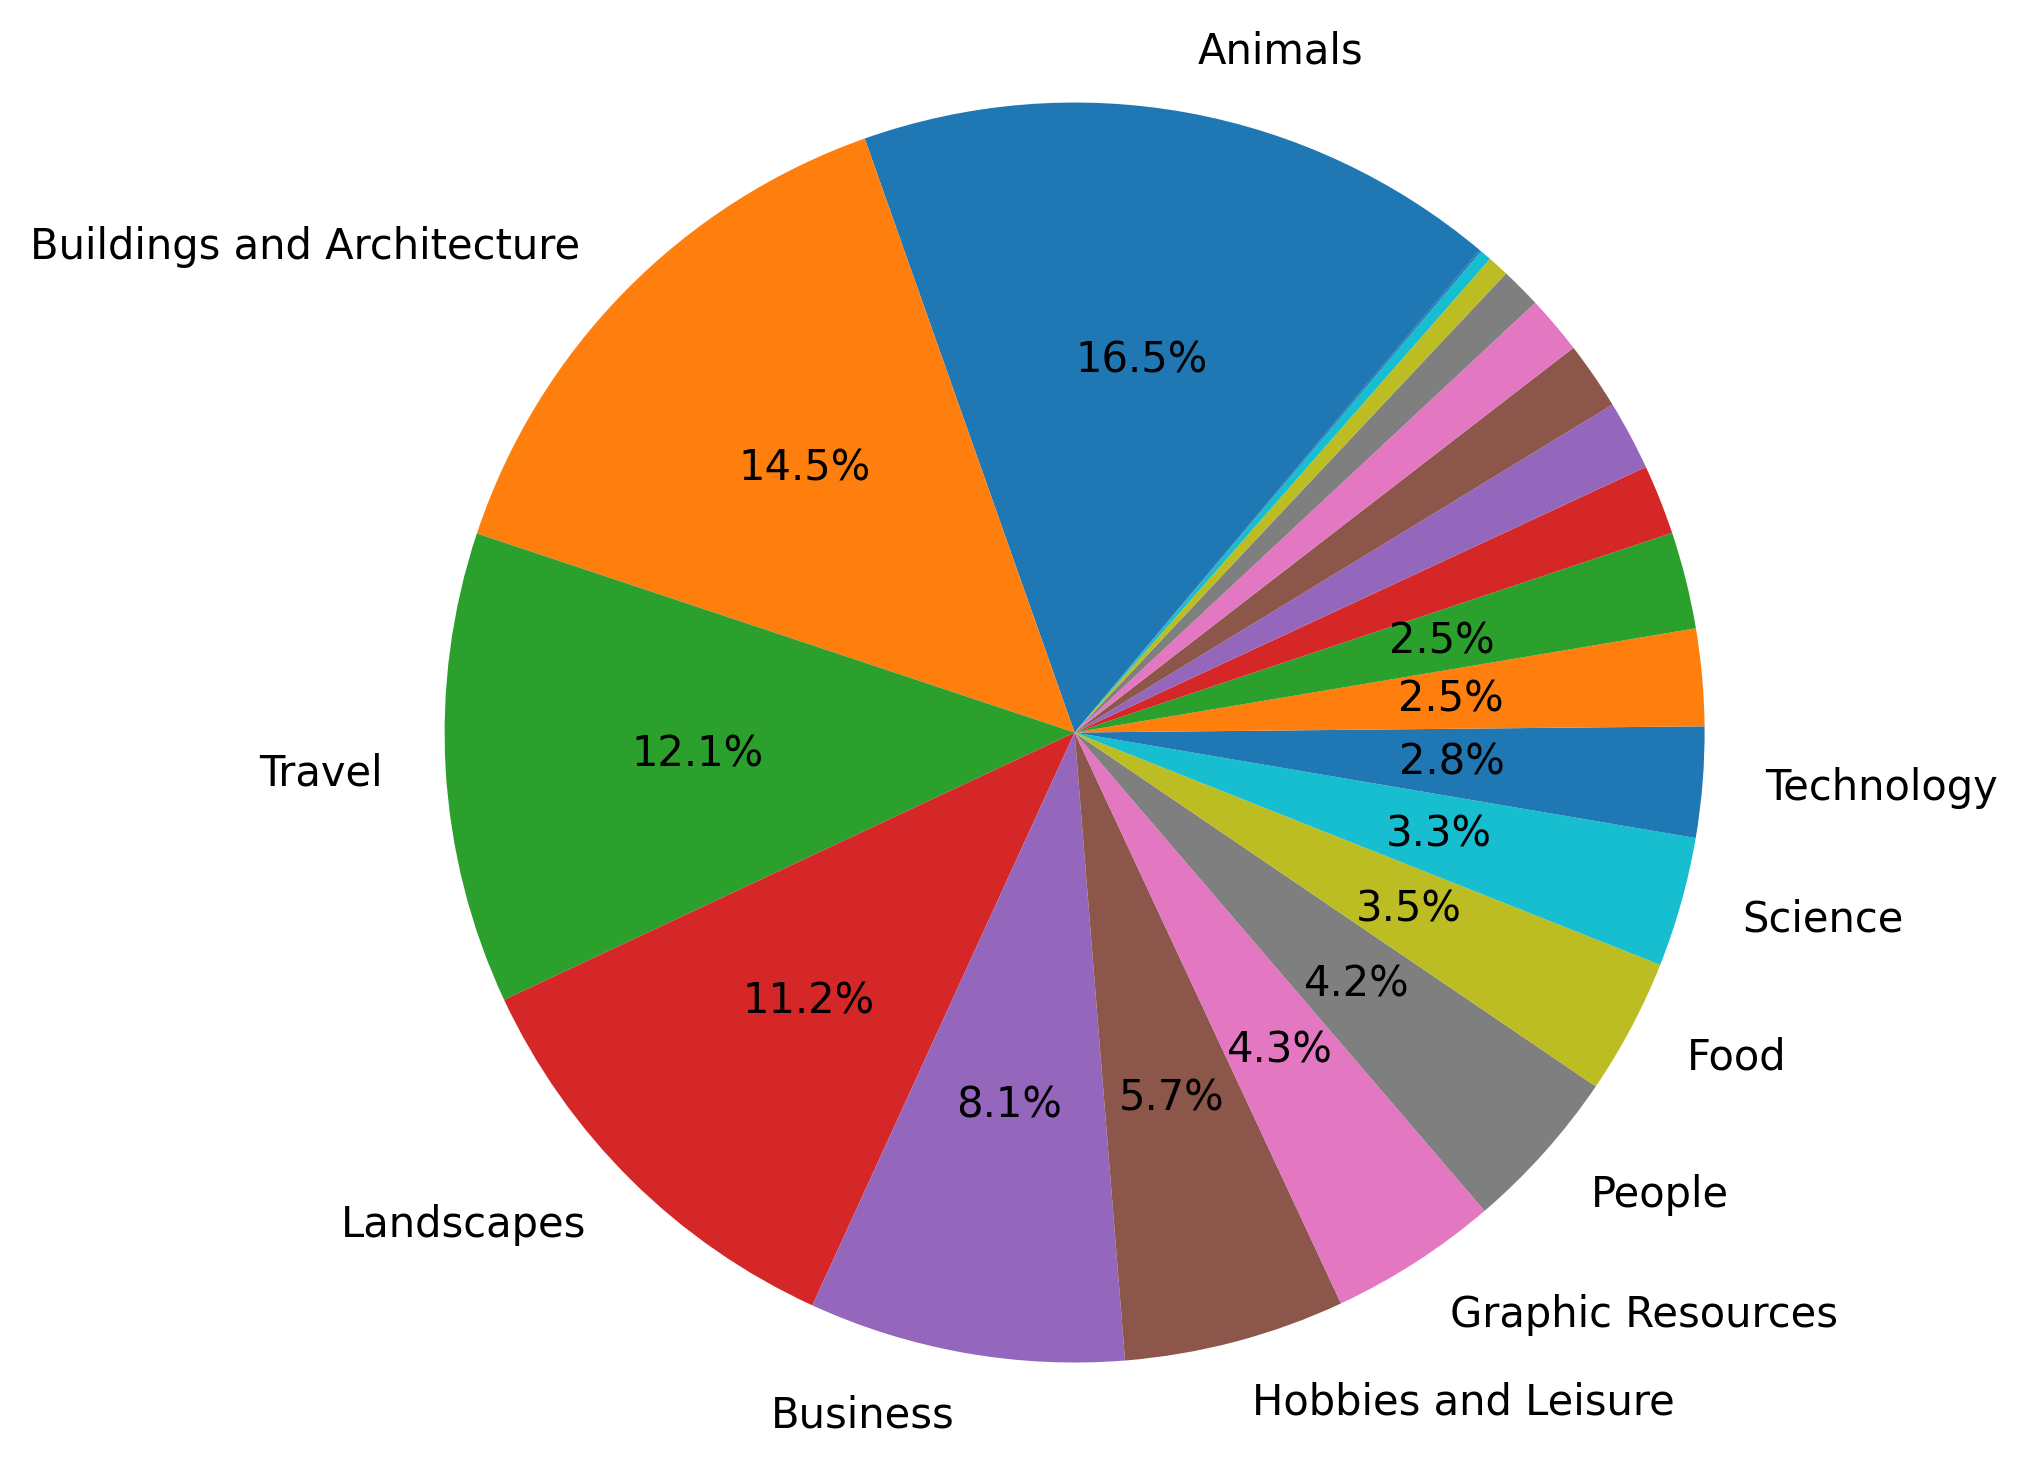
Split by category on Adobe Stock
And immediately surprising that “Animals”, which performs so well for Steve on Shutterstock, does not work here. In fact, it’s the largest category with not-selling content. Other categories are more in tune with the proportions of best-seller categories. So let’s look at the split inside categories.
NOTE: these are not the earnings amounts, but the file counts, which yielded good and low earnings
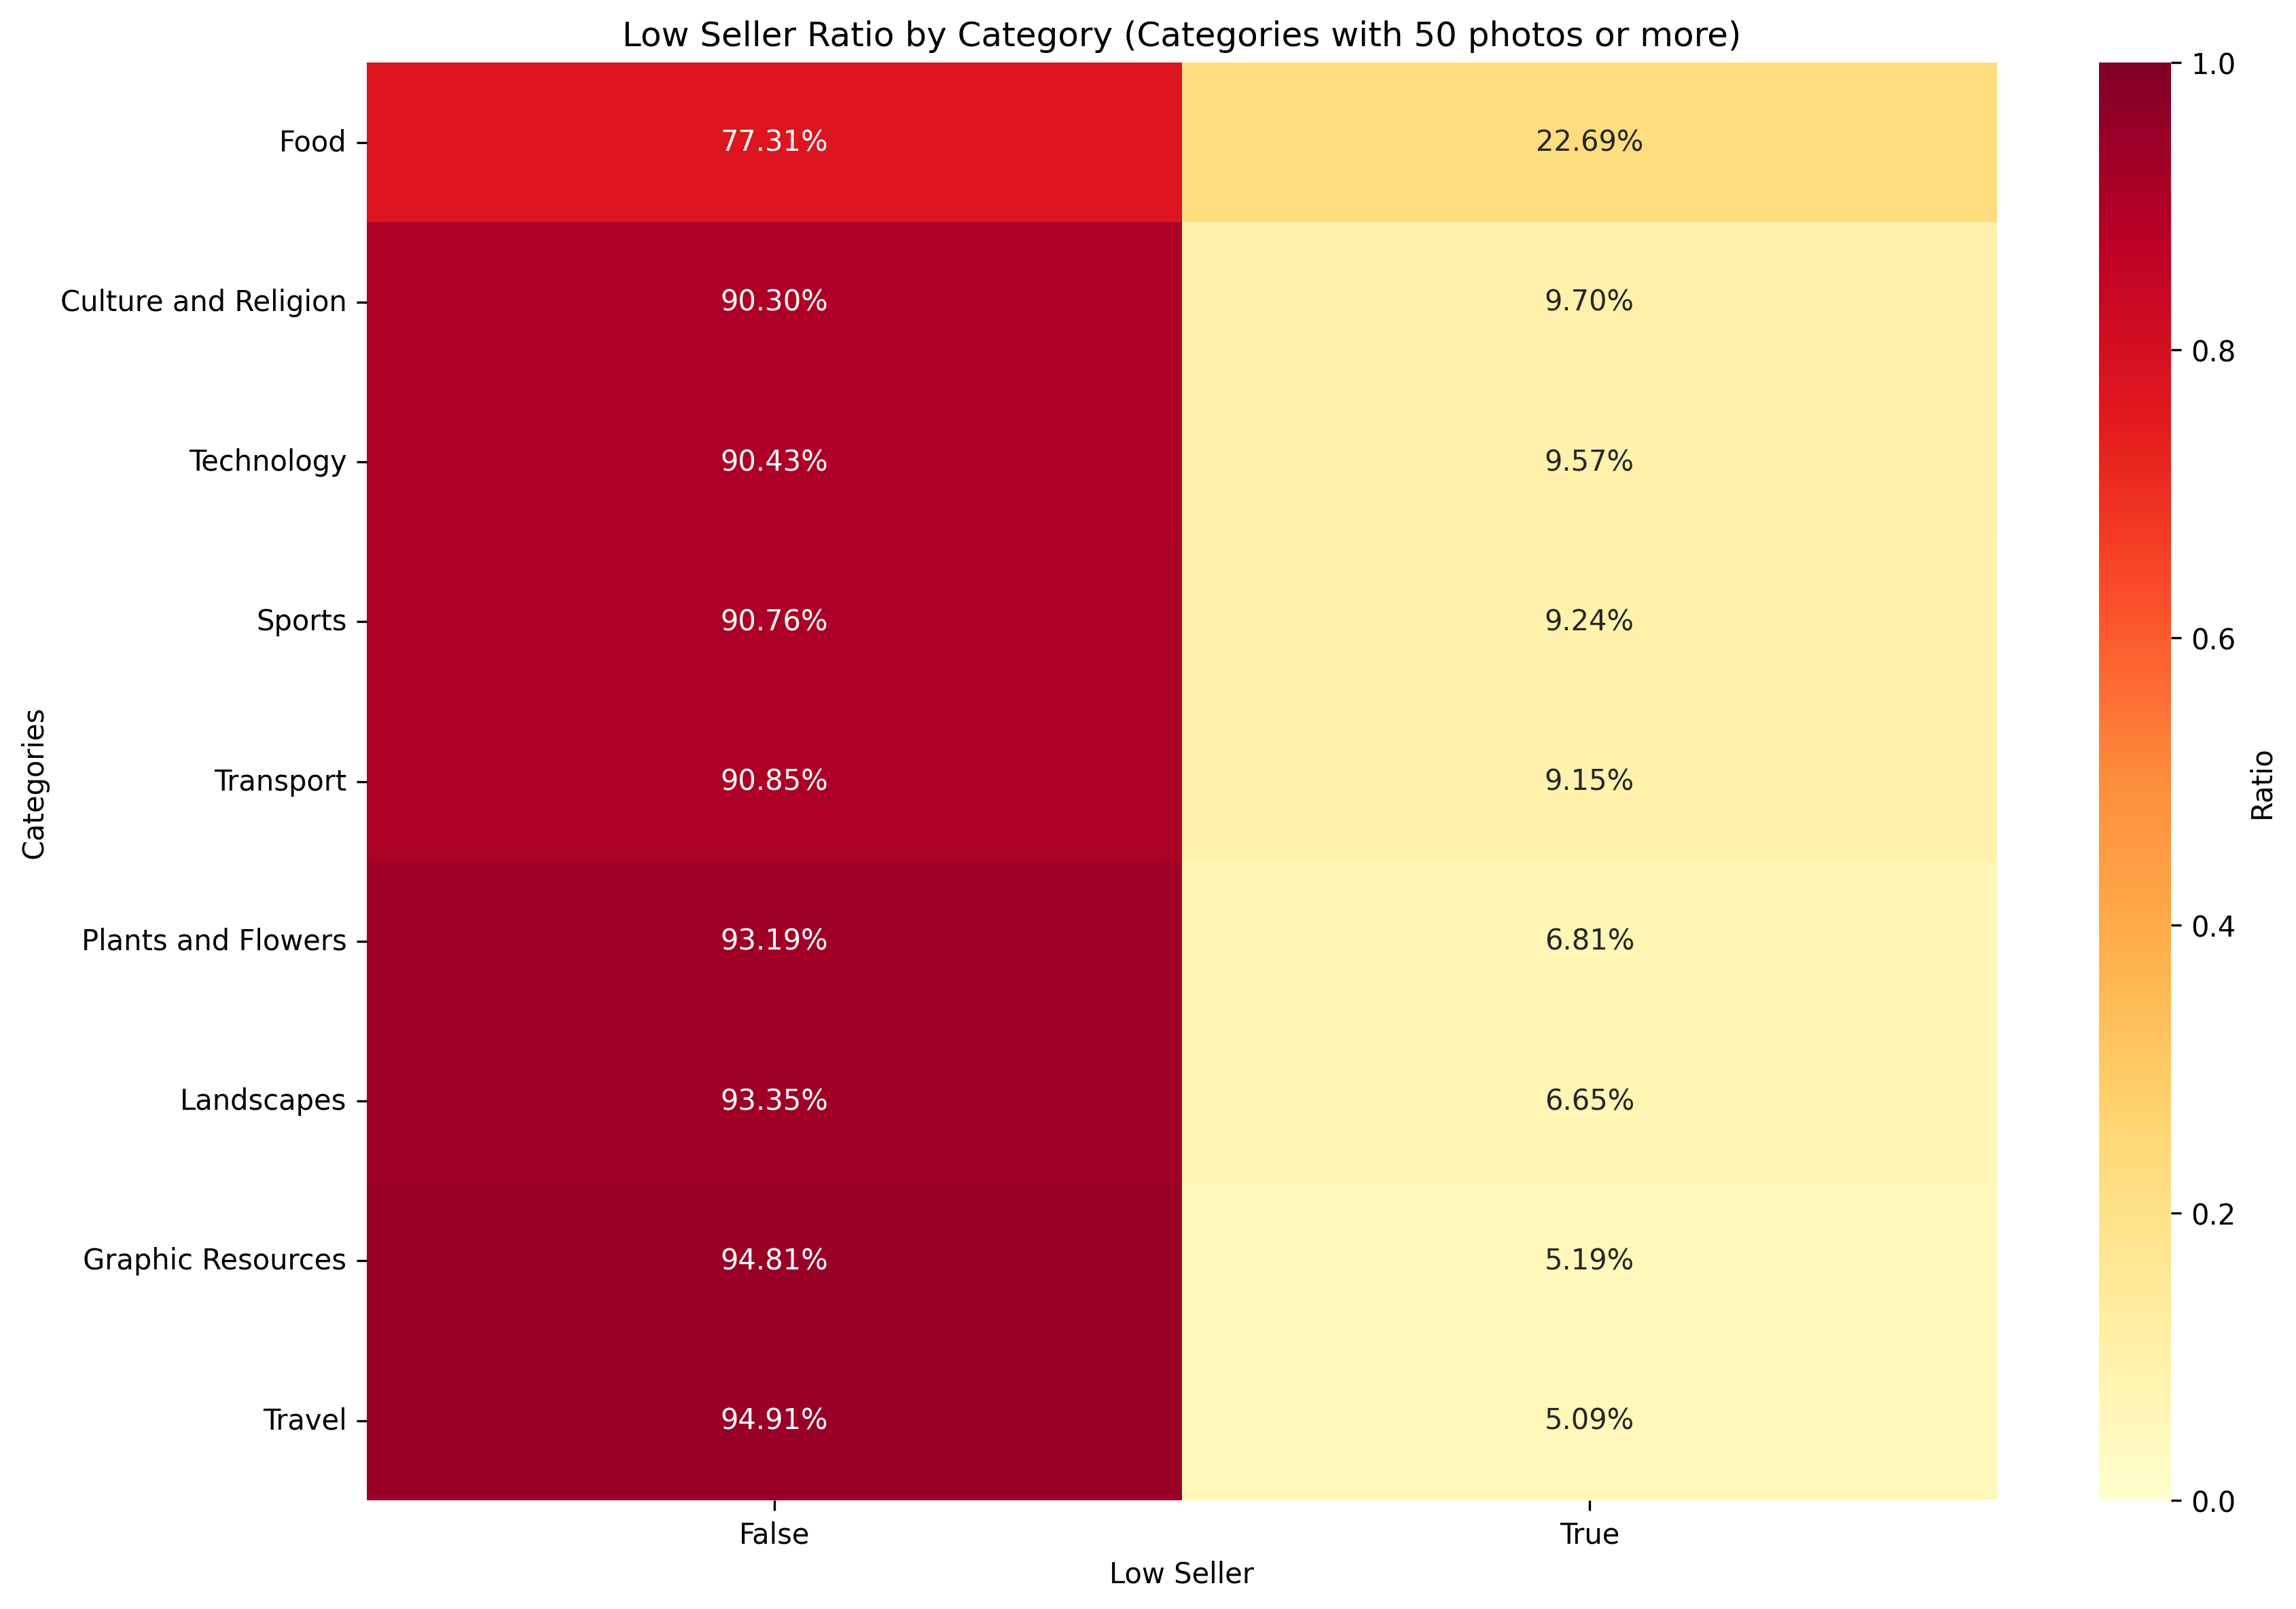
Adobe ratio of 'low sellers' and 'business-as-usual' per category
Again, a very different story from Shutterstock. Apparently, for Steve, the following categories did not work so well on Adobe Stock:
| Category | “Good” sellers (% of total) | “Bad” sellers (% of total) |
|---|---|---|
| Food | 77.31% |
12.69% |
| Culture and Religion | 90.3% |
9.7% |
| Technology | 90.43% |
9.57% |
| Sports | 90.76% |
9.24% |
| Transport | 90.85% |
9.15% |
Although “Religion” is apparently a consistently tough nut to crack on microstocks, here we can see that “Food”, which is totally missing on Shutterstock, here is the most risky one. Another consistently “bad” one is “Technology”. On the other hand, “Transportation”, which on Shutterstock is one of the “safest” for Steve, here is among the top risky categories to create content for.
Looking at the “safest” ones, the picture is this:
| Category | “Good” sellers (% of total) | “Bad” sellers (% of total) |
|---|---|---|
| Lifestyle | 96.3% |
3.7% |
| Business | 96.62% |
3.38% |
| Drinks | 97.55% |
2.45% |
| Science | 97.86% |
2.14% |
No consistency with Shutterstock, which is great actually and suggests how good is to be selling on both of these platforms.
Learning from mistakes
It is interesting to explore the trend of low-earners over the years. First of all, let’s check how many low-earners Steve was creating throughout his career:
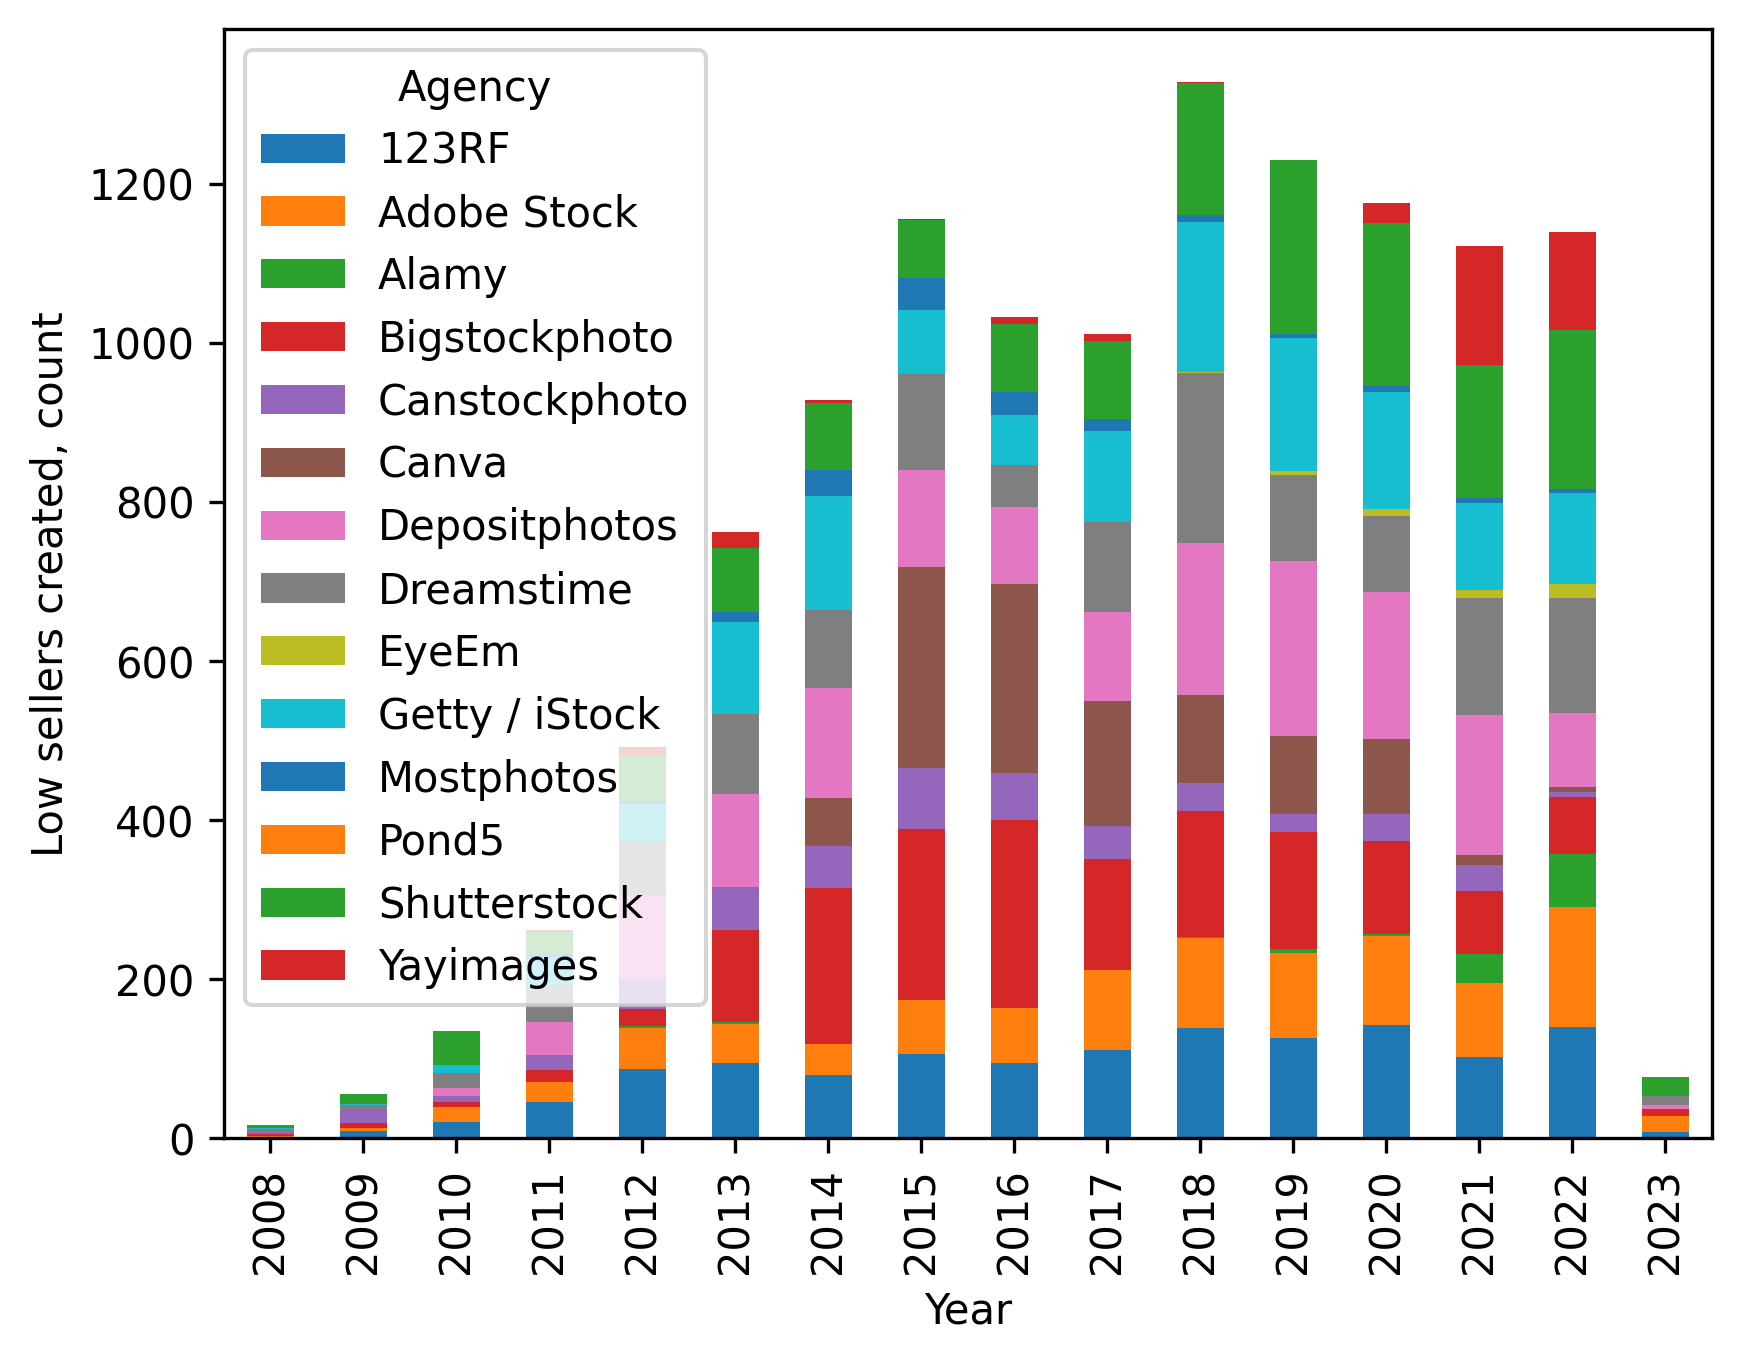
Number of low-to-none earning files in all agencies
Overall the number is relatively consistent, which is great if you take into account that Steve was uploading progressively more files. Another important thing to note is that just having produced and uploaded these files was a necessary condition to learn from failure itself. Is this what, perhaps, enabled him to produce better files? Lets check!
Shutterstock
Let’s explore Shutterstock again and split the yearly trend by category.
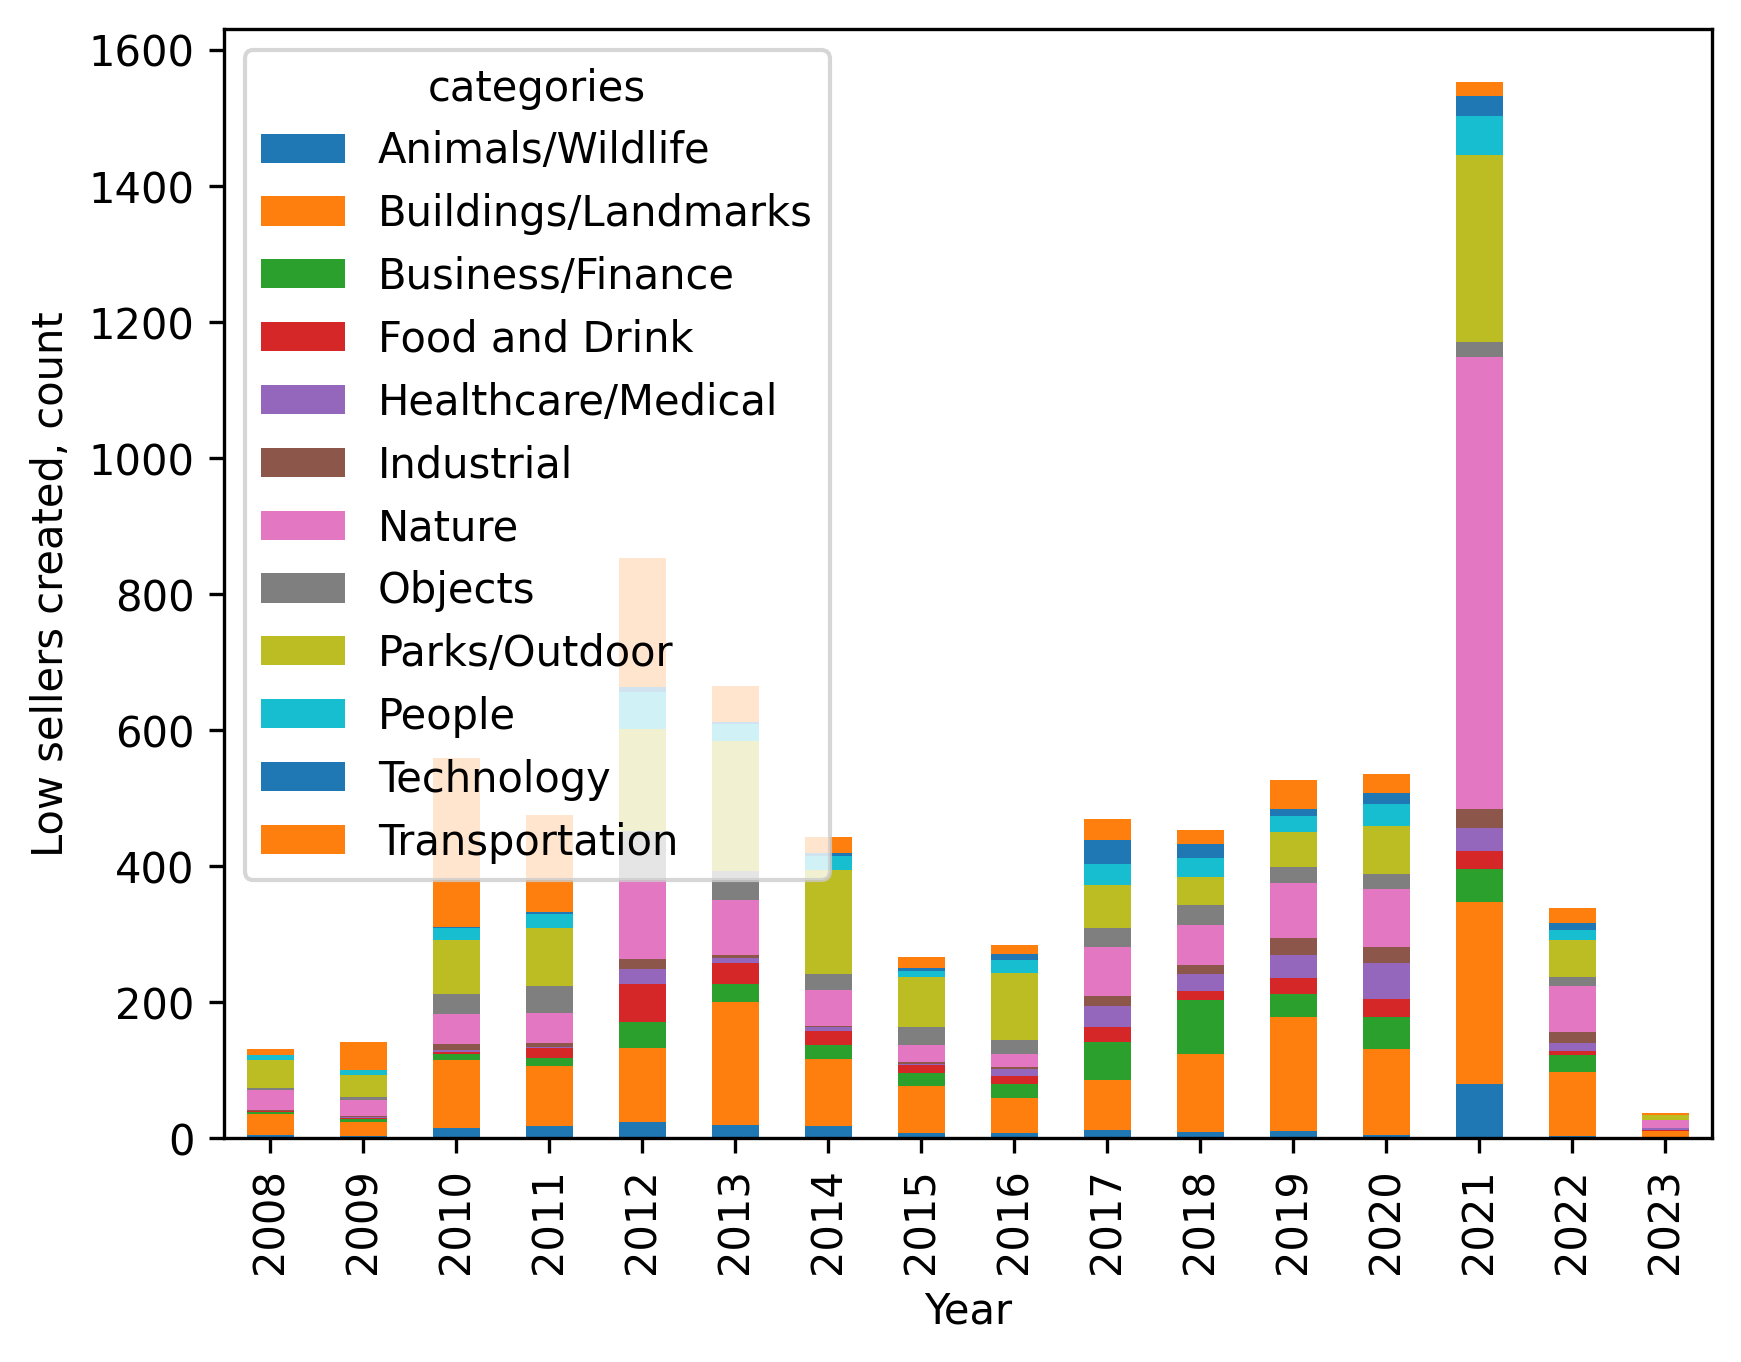
'Failed' files per category per year on Shutterstock
Apart from the disastrous 2021 year on Shutterstock, there are a few interesting trends to note. The light green “Parks/Outdoors” category has been increasing for the first 5 years or so and then steadily declined. To me, it suggests that Steve “learned the ropes” of how to make better-selling pictures in this category. “Nature” category (pink) is slightly less pronounced but follows the same trend. “Buildings/Landmarks” (the upper orange) is even more pronounced as, if you look at Steve’s portfolio and our previous analysis, contains many of his best-sellers.
At the same time, there are still categories “hard to crack”, at least from this chart. Those are “Business/Finance” (green), dreaded “Transportation” (lower orange), and “Healthcare/Medical” (purple).
Adobe Stock
Looking at Adobe Stock, here’s the yearly trend per category.
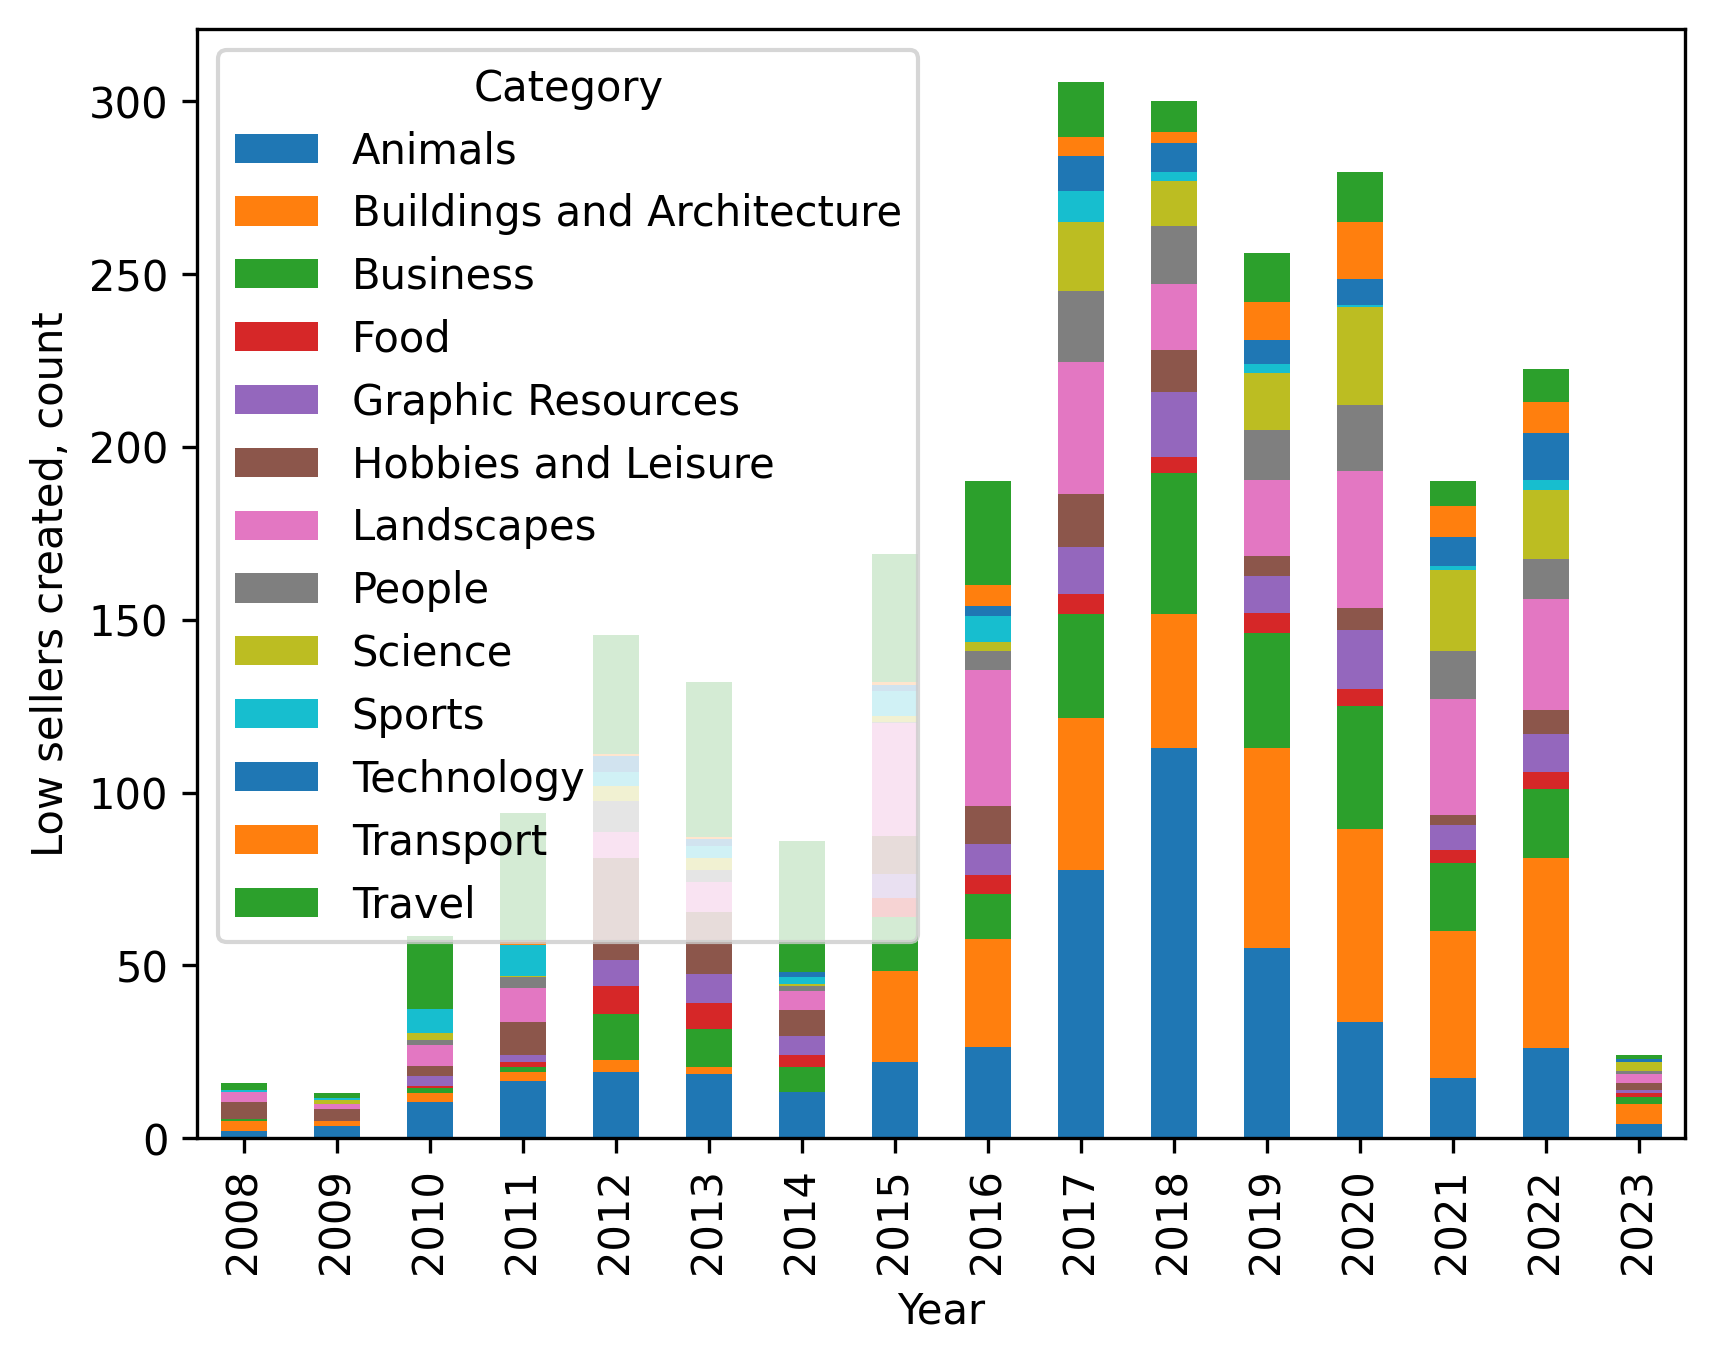
'Failed' files per category per year on Adobe Stock
Adobe Stock, interestingly, does not contain the “crash of 2021” in Steve’s portfolio and is more stable. From the chart, it looks like it took many years for Steve to master the demand of “Technology” (orange) and “Transport” (lower orange) categories on Adobe, where the number of created low-selling pictures does not go down. However, he did much better in “Business” (upper green), “Sports” (light blue), and “Hobbies and Leisure” (brown).
Was it worth it
Again, in the beginning we defined “low earner” as a file that produced less or equal to $1 per lifetime, the whole 16 years. Now, summing up all the “nothing” that these files earned, it totals to $10,735. Yes, that is 10 thousands USD, which is quite far from “nothing” in my opinion.
However, even more than direct income, I think creating and uploading bad-selling pictures is a necessary condition to learn. To accelerate learning you do need to keep track of sales and reflect on what didn’t work and why. But even then sitting in the comfort zone of your best-sellers is not the answer. To keep microstocks paying you, you need to evolve and expand to new areas, where you will inevitably make mistakes (content that does not sell). And that’s OK.